Add a Bus
and a
Third
Processor
Either type gui architecture.sim and hit enter at the command line, or select File/Open from within the GUI.B.) Zoom-Out so you can add new boxes.
C.) Replicate one of the processors, by:
- Select one of the existing processor boxes by pointing at it in Select/Move mode.
- Hit Edit/Copy, or control-C, to copy the object.
- Hit Edit/Paste, or control-V, to paste the object.
- Move the replicated processor below the other two.
- Open it's properties to set it's instance name to processor_C.
Set it's instance name to be Bus.
Set it's type to be local_bus.
(Hint: Use the Types button next to the Type-Name field.)
E.) Move the link connecting processor_A and processor_B so that it connects processor_A to the Bus.
Do this in Select/Move mode by grabbing the vertex (arrow) attached to processor_B and swinging it over to the BusF.) Replicate the link to connect the other two processors to the bus.
- Do this in Select/Move mode by selecting the link,
- Hit Edit/Copy, or control-C, to copy the link.
- Hit Edit/Paste, or control-V, to paste the link.
- Move the replicated link to connect processor_B to the Bus.
- Repeat for processor_C.
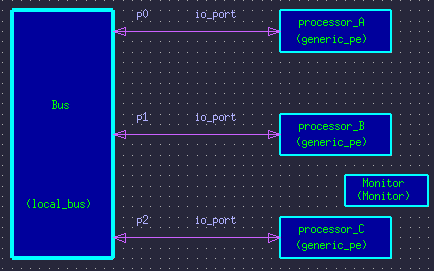
The diagram should appear as shown here:

H.) Save your diagram: File / Save
You have now expanded the hardware architecture model.
Build
Hardware
Watch the text window from which you launched the GUI for messages about the status of the build-processing.
Update
Routing
Table
Because you changed the hardware architecture, it is necessary to re-build the routing table.
Expand
Software
Application
Graph
Either type gui DFG_1.dfg and hit enter at the command line, or select File/Open from within the GUI. You should see your old graph.
B.) Add two new nodes to your data flow graph.
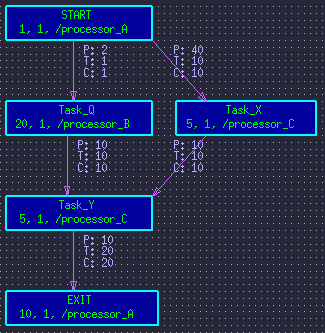
Connect the nodes with arcs.Make the graph appear as this:
C.) Set the properties of the new boxes to be:
- Instance Name = Task_X
- Compute Time = 5
- Map PE = /processor_C
- Instance Name = Task_Y
- Compute Time = 5
- Map PE = /processor_C
For the arc connecting the START box and the Task_X box:
- Produce Amount = 40
- Threshold Amount = 10
- Consume Amount = 10
- Produce Amount = 10
- Threshold Amount = 10
- Consume Amount = 10
- Produce Amount = 10
- Threshold Amount = 10
- Consume Amount = 10
E.) Save your diagram: File / Save
You have now expanded your application Data Flow Graph (DFG).
Build
Software
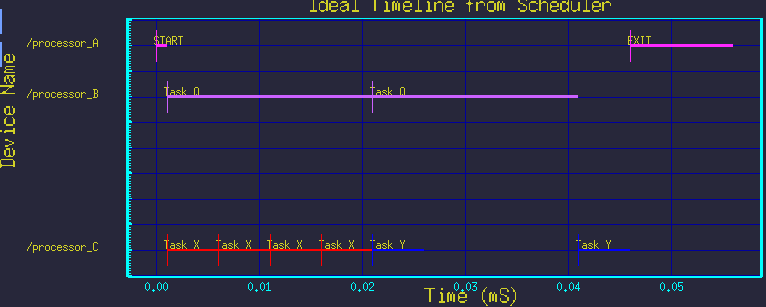
Watch the text window from which you launched the GUI for messages about the status of the build-processing.You can plot the ideal timeline by: Tools / Plot Ideal Timeline.
It should look like:

Note that the ideal time-line does not consider actual data transfer delays nor the effects of contentions on such transfers. Only task computation sequences and concurrencies are considered.
Run the
Simulation
The simulation control panel window will pop up.
Hit Run/Cont..
View
Time-Line
Results
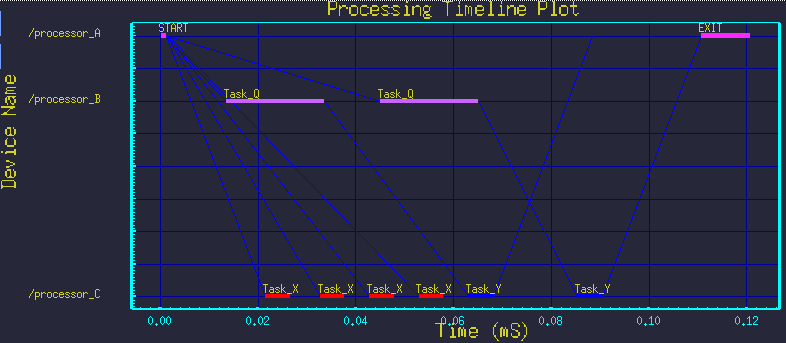
The graph should appear as:The diagonal or vertical lines represent the data transfers between processors. The horizontal lines indicate the processing of tasks. Dismiss the graph.


