Create
Hardware
Architecture
Graph
mkdir test_exampleB.) Open the GUI to a new blank graph.
cd test_example
Either type gui and hit enter at the command line, or select File/New from within the GUI. You should see a blank graph with no objects.C.) Include the library items you will need.
Select: File / Import / by Reference to FileD.) Draw a simple architecture.
You should pick the following items from the csim/model_libs/core_models directory of your CSIM installation. (You can get to this quickly by pressing the check-mark next to the file-name field. Select $CSIM_MODEL_LIBS and click OK, then select core_models.)
It is important to include these in the above order.
- monitor.sim
- generic_pe.sim
- lbus.sim
(If you make a mistake, you can fix it later under Edit/Special/Edit-Include-Files or by directly editing the resulting %includes in your save-file.)
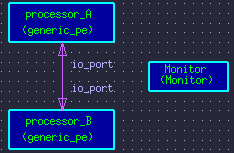
- Select Add: Box/Node on the left Draw Mode Palette.
- Click down three boxes somewhere on your canvas.
Everywhere you click will add one box. Don't worry about messing up. You can fix whatever you do. (If you want to erase a box, click Select/Move on the left Draw Mode Palette. Then select the object you want to remove and press the delete-key, or hit Edit/Cut, which is equivalent to pressing control-x.) - Select Add: Link/Arc on the left Draw Mode Palette.
- Click once to start the link on the border of one of your boxes.
Then move your mouse to the border of the second box and double-click
to end the link. A link should now be connecting your first two boxes.
(No link connecting to the third box.)
Now to set the box properties ...
- Select Select/Move on the left Draw Mode Palette.
- Double-click on a box (or click the box and hit Open-Properties). A properties dialog should pop-up. You can change the Instance Name of the box to anything you prefer, such as a processor name, say processor_A. Now set the Type-Name. This is easiest by clicking the Types button to the right of the Type-Name field. Select generic_pe. You could also type this in, but it is less error prone to select the Type-Name from the designated list. (If you don't see the type in the list, then you did not properly import the generic_pe library file. Go back and re-do step C above.) Finally, hit Ok to accept and close the dialog.
- Repeat the last step again on your second box, to set it's Instance-Name and Type-Name. Remember that the Instance-Name must be unique. For example, set it to processor_B. (For this example, the Instance-Names are not really that important, you can accept the default names, if you wish.) The Type-Name is very important. Set it to generic_pe as with the other box.
- Repeat the last step again on your third box, to set it's Instance-Name
and Type-Name to both be Monitor.
Now to set the link properties ...
- Double-click on the link connecting the first two boxes, (or click on the link
and hit Properties).
A properties dialog should pop-up.
- Set the Rate to 1.0.
- Set the Port Names to io_port.
(The best way to do this is to select the Names button to the right of each port. This way you assure correct spelling. If the names list does not contain the correct names, then either you have the wrong Type-Name in the box connected to the link, or the link is not connected to a box, or you did not successfully load the correct library. Repeat the appropriate step above to fix it.) - You can leave the other fields as they are.
- Hit Ok to accept and close the dialog.

E.) Save your diagram: File / SaveAs
(Use a name like: architecture.sim)
Because the file browser was last visiting the model-library, the path may still be pointing to that directory, which you should not have write-permissions for. To get back to your local directory, you should enter the full pathname of your local directory, starting with the slash "/". You have now created a simple hardware architecture model.
Build
Hardware
Watch the text window from which you launched the GUI for messages about the status of the build-processing. If successful, you should see messages such as:If there were any problems during the build, you should see messages that help you diagnose the problem. (You cannot proceed to the subsequent steps until you have a successful build.)Executing: $CSIM_ROOT/tools/$CSIM_MTYPE/csim_v1.9 arch.simYou may see a warning about an unused device definition. That is correct. The key phrases to look for are always:
DONE (csim pre-processing).
0 Errors 0 WarningsAttempting C-compile (cc ... sim.exe).
Executing: sim.exe -net_extractWelcome to CSIM (version 2.0)
- 0 Errors 0 Warnings
- Welcome to CSIM
Build
Routing
Table
Watch the text window from which you launched the GUI for messages about the status of the Router. You should see messages such as:
- Completed routing.
- Writing routing table to file netinfo.rte
Create
Software
Application
Graph
Either type gui and hit enter at the command line, or select File/New from within the GUI. You should see a blank graph with no objects.B.) Switch to Edit DFG SW Graph Mode.
Select: Tools / New SW GraphC.) Draw a simple Data flow Graph.
(This must be done on a blank graph. You cannot switch modes with objects on a graph.)
- Select Add: Box/Node on the left Draw Mode Palette.
- Click down three boxes somewhere on your canvas.
- Select Add: Link/Arc on the left Draw Mode Palette.
- Click once to start the link on the border of your first box. Then move your mouse to the border of the second box and double-click to end the link. A link should now be connecting the first two boxes.
- Connect your second and third boxes with a similar link.
Now to set the box properties ...
- Select Select/Move on the left Draw Mode Palette.
- Double-click on the first box.
In the properties dialog,
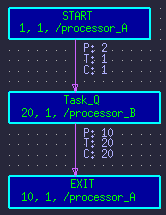
- set the Instance-Name to START.
- You can leave the Type-Name blank.
- Set the Compute Time to 1.
- Set the Iterations to 1.
- Set the Map PE to /processor_A.
- Repeat the last step again on your second box, but ...
- Set it's instance-name to Task_Q.
- Set the Compute Time to 20.
- Set the Map PE to /processor_B.
- Repeat the last step again on your third box, but ...
- Set it's instance-name to EXIT.
- Set the Compute Time to 10.
- Set the Map PE to /processor_A.
Now to set the arc properties ...
- Double-click on the link connecting the first two boxes.
In the properties dialog,
- Set the Produce Amount to 2.
- Set the Threshold Amount to 1.
- Set the Consume Amount to 1.
- Set the Initial Amount to 0.
- Leave the other fields as they are.
- Hit Ok to accept and close the dialog.
- Double-click on the link connecting the second two boxes.
- Set the Produce Amount to 10.
- Set the Threshold Amount to 20.
- Set the Consume Amount to 20.
- Set the Initial Amount to 0.

D.) Save your diagram: File / Save-As
(Use a name like: DFG_1.dfg)
You have now created a simple Data Flow Graph (DFG).
Build
Software
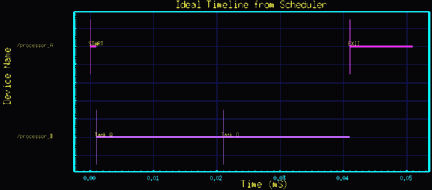
Watch the text window from which you launched the GUI for messages about the status of the build-processing. If successful, you should see messages such as:You can plot the ideal timeline by: Tools / Plot Ideal Timeline.
- Writing program files to ./pe_xx.prog
- Done.
It should look like:

Note that the ideal time-line does not consider actual data transfer delays nor the effects of contentions on such transfers. Only task computation sequences and concurrencies are considered.
Run the
Simulation
The simulation control panel window will pop up.
Hit Run.
View
Time-Line
Results
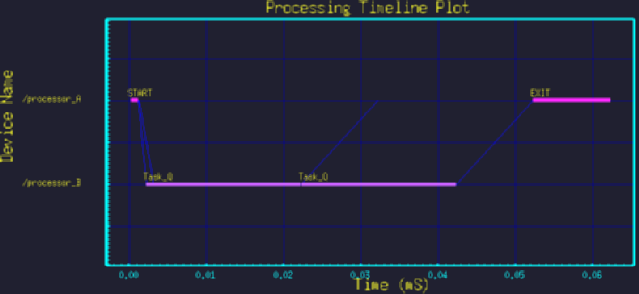
The graph should appear as:The diagonal or vertical lines represent the data transfers between processors. The horizontal lines indicate the processing of tasks. Dismiss the graph.

