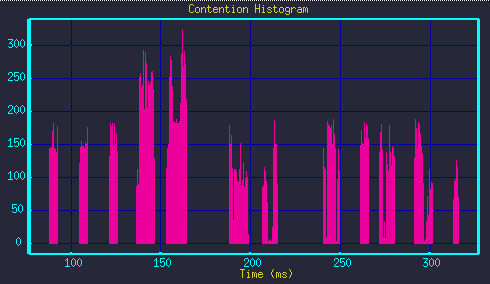
It will show the contention- and message- counts to the screen. The normal count represents the number of successful messages that went through each link. For example, if one message went through a path containing 10-links, the message count would be 10. The number of contentions indicates the number of times a message transfer was attempted at a link and was turned-away due to contention. Each retry increments the contention count.
By default, view_contention also produces a histogram graph file of the same root name, but with .hst suffix, (ie. LinkTline.hst). View the histogram by:
xgraph LinkTline.hst
Options
The default graph-name can be overridden by placing a second file-name on the command line. The graph will be written to that file.By default, the histogram window (resolution) is set to 100-uS = 0.1-mS interval. The histogram integrates contention events within the window interval to determine the hight of the histogram bar. You can specify a finer or coarser window by using the -w command-line option.
Example:
view_contention LinkTline.dat -w 0.5
Example:
> csim/tools/view_contention LinkTline.dat Writing contention histogram graph file LinkTline.hst (View with: xgraph LinkTline.hst ) Summary: 9756 Contention Events 44108 Normal (Non-Contention) Transfer Events > xgraph LinkTline.hst
(Questions, Comments, & Suggestions: admin@csim.com)
