Viewing Results
With CSIM, there are several ways to view the results of your simulations. Some depend on what you are simulating, what data you want to view, and how you wish to display it. For example, if you are doing architecture-performance modeling, you may wish to view activity-timeline plots. But if you are doing purely functional modeling, then you may wish to view statistical scatter-plots, histograms, or arbitrary data curves.
CSIM provides a variety of tools to support these various applications. Some are general purpose and are useful for all applications. Others are specific to a particular type of modeling or view. Additionally, new viewing tools are continually being contributed.
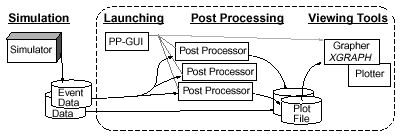
This page provides a brief overview of the viewing tools, with links to detailed documentation on each utility. The tools are divided into three groups by function, as shown in figure 1 below:
- Launching Tools - Convenience for orchestrating selection of post-processing options and viewing operations by window/menu interface.
- Post-Processing Tools - Utilities which process raw simulation event-history files to produce graph files that can be plotted by most general purpose graphing tools. These tools extract or arrange information. They accept, analyze, and produce data files. (Others could be contemplated and contributed.)
- Viewing Tools - Graphical data viewing tools. These tools display data from data files. For visualizing numerical data.

Figure 1 - Post-processing and Viewing Tools.
Note the lines connecting data files show not only that there are different kinds of files, but also that some files can go straight from simulation models to the graphing tools without post-processing.
Aside from basic modularity, there are many advantages to the overall philosophy. For example, results may be processed once, perhaps off-line, archived, and viewed many times later.
Although the tools are commonly launched from the GUI, they are also often invoked directly from the command-line or scripts.
- Launchers:
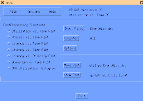
- PPGUI - The new Post-Processor launching tool.
This is a convenience utility that lets you launch several
analysis tools and view their results with XGRAPH.
It allows you to select options by menus.
(Supported only by platforms having glibs.)
Launched by clicking Tools / Post Analyze EvenHist.
(Further documentation on this tool is forthcoming.)

- PP_GUI - Slightly older version of PPGUI, but supported on all platforms.
Does not offer all the newest features of ppgui, such as reviewing
the contents of EventHist.dat and prompting you with menu selections.
However, some have found this version simpler to learn for beginners.
(Further documentation on this tool is forthcoming.)

- PPGUI - The new Post-Processor launching tool.
This is a convenience utility that lets you launch several
analysis tools and view their results with XGRAPH.
It allows you to select options by menus.
(Supported only by platforms having glibs.)
Launched by clicking Tools / Post Analyze EvenHist.
(Further documentation on this tool is forthcoming.)
- Post-Processors:
- Time-Line PP - Processes the
EventHist.dat file from a performance model simulation run, and
produces a Processor Activity versus Time or Time-Line file that
can be viewed with XGRAPH.
(Location: $CSIM_ROOT/tools/platform/timeline.)
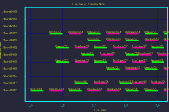
Example output as viewed by XGRAPH:
- Contention-Viewer PP - Processes the
EventHist.dat file from a performance model simulation run, and
infers the number of network contentions that occurred over time.
it produces a Contentions versus Time file that can be plotted with XGRAPH.
(Location: $CSIM_ROOT/tools/platform/view_contention.)
Example output as viewed by XGRAPH:
- Utilization Histograms PP -
Reads the EventHist.dat file from a performance model simulation run, and
produces a CPU Utilization Histogram that can be
viewed with XGRAPH. This post-processor places hyper-notes in the graph
that can be viewed by clicking on the bars.
(Location: $CSIM_ROOT/tools/platform/postproc/utilhist_proc.)
Example output as viewed by XGRAPH:
- Message-Latency PP -
Reads the EventHist.dat file from a performance model simulation run, and
produces a Message-Delay versus Simulation-Time scatter-plot file that can be
viewed with XGRAPH.
(Location: $CSIM_ROOT/tools/platform/postproc/message_pp.)
(Location: $CSIM_ROOT/tools/platform/postproc/clat_pp.)
(Further documentation on this tool is forthcoming.) - Process-Timeline PP -
Reads the EventHist.dat file from a performance model simulation run, and
produces a Process versus Time or Time-Line file that can be
viewed with XGRAPH. It shows each process that ran on a CPU, grouped by CPU,
vertically displaced on the Y-axis. Horizontal extent of each process shows
when it was active on each CPU. This post-processor places hyper-notes in the graph
that can be viewed by clicking on the bars.
(Location: $CSIM_ROOT/tools/platform/postproc/proc_pp.)
(Further documentation on this tool is forthcoming.)
- Time-Line PP - Processes the
EventHist.dat file from a performance model simulation run, and
produces a Processor Activity versus Time or Time-Line file that
can be viewed with XGRAPH.
- Viewers:
- XGRAPH - General purpose 2D graphing tool.
Used for many, many things, including curves, scatter-plots, bar-graphs,
histograms, etc..
(Location: $CSIM_ROOT/tools/platform/xgraph.)
- XYZ - 3D mesh graphing tool.

- CONTOUR - Contour plotter.

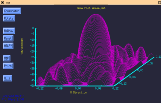
- SolidXYZ - Solid surface plotting tool.

How to use:
Because usage depends on what you are doing, we organize this section by scenario.Examples of usage are provided in the course, the various tutorials, and examples.
- XGRAPH - General purpose 2D graphing tool.
Used for many, many things, including curves, scatter-plots, bar-graphs,
histograms, etc..
