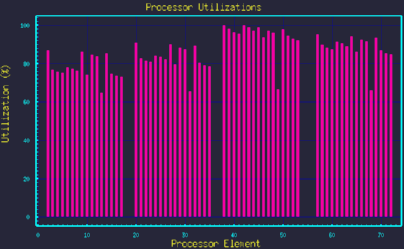
The UtilHist utility reads your summaries.dat file from a simulation run, and extracts the processor utilization information to produce a histogram (bar-chart) plot-file that is viewable with XGRAPH.
UtilHist assumes you are in the directory where you ran a simulation based on models from CSIM's Modelibs/CoreModels performance-model library, or equivalent, such as the demo_examples models. These models produce a human-readable file called summaries.dat at the end of the simulation. It contains the processor (PE) utilization results. However, summaries.dat is not in the form of a plot-file.
UtilHist first scans your netinfo file to find the ID-numbers corresponding to the names of each of your Processor Elements (PE's). It uses these numbers to determine the position on the graph's horizontal-axis to display the utilization-bar corresponding to each PE.
Next, UtilHist scans your summaries.dat file to extract the utilization results into the plot-file called, utilhist.dat. View it with, XGRAPH.
utilhistThis produces a graph as shown below.
xgraph utilhist.dat

See also Process-Utilz-Hist-PP for an alternate Process Utilization histogram post-processor.